
One of the strongest methods of conveying information in the modern web application is data visualization. This tutorial in Rss Letter No 0876 will teach you to create gorgeous, responsive SVG charts in React JavaScript with no third-party charting library. By the end of this guide, you’ll have a complete, working SVG chart component that you can customize for your own projects.
Why Use SVG Charts in React?
SVG (Scalable Vector Graphics) is the perfect choice for building charts in React applications. Here’s why developers love this combination:
- Scalability: SVG charts look crisp on any screen size or resolution.
- Performance: Lightweight compared to canvas-based alternatives.
- Customization: Full control over every element, color, and animation.
- Accessibility: SVG elements can be styled with CSS and made screen-reader friendly.
- No dependencies: No need to install heavy third-party libraries.
This Rss Letter No 0876 guide focuses on pure React and SVG keeping your bundle size small and your code clean.
Prerequisites
Before starting this Rss Letter No 0876 tutorial, make sure you have:
- Basic knowledge of React (hooks like
useStateanduseEffect). - Node.js and npm installed on your machine.
- A React project set up (using Create React App or Vite).
- Familiarity with JSX syntax.
Setting Up Your React Project
If you don’t already have a React project, create one using the following command:
bash
npx create-react-app svg-chart-demo
cd svg-chart-demo
npm start
Once your project is running, create a new component file called BarChart.jsx inside the src folder.
Building a Basic SVG Bar Chart
Let’s start with a simple bar chart component. Here’s the complete code for this Rss Letter No 0876 example:
jsx
import React from 'react';

const BarChart = () => {
  const data = [
    { month: 'Jan', value: 60, color: '#3498db' },
    { month: 'Feb', value: 80, color: '#2ecc71' },
    { month: 'Mar', value: 70, color: '#e74c3c' },
    { month: 'Apr', value: 90, color: '#f39c12' },
    { month: 'May', value: 100, color: '#9b59b6' },
    { month: 'Jun', value: 50, color: '#1abc9c' },
  ];

  const chartWidth = 600;
  const chartHeight = 400;
  const padding = 60;
  const maxValue = 100;

  return (
    <svg
      viewBox={`0 0 ${chartWidth} ${chartHeight}`}
      xmlns="http://www.w3.org/2000/svg"
      style={{ background: '#f8f9fa', borderRadius: '8px' }}
    >
      {/* Chart Title */}
      <text
        x={chartWidth / 2}
        y="30"
        textAnchor="middle"
        fontSize="20"
        fontWeight="bold"
        fill="#2c3e50"
      >
        Monthly Sales Chart
      </text>

      {/* Y-Axis */}
      <line
        x1={padding}
        y1="60"
        x2={padding}
        y2={chartHeight - padding}
        stroke="#34495e"
        strokeWidth="2"
      />

      {/* X-Axis */}
      <line
        x1={padding}
        y1={chartHeight - padding}
        x2={chartWidth - 40}
        y2={chartHeight - padding}
        stroke="#34495e"
        strokeWidth="2"
      />

      {/* Bars */}
      {data.map((item, index) => {
        const barWidth = 50;
        const barSpacing = 80;
        const x = padding + 40 + index * barSpacing;
        const barHeight = (item.value / maxValue) * 275;
        const y = chartHeight - padding - barHeight;

        return (
          <g key={item.month}>
            <rect
              x={x}
              y={y}
              width={barWidth}
              height={barHeight}
              fill={item.color}
              rx="4"
            />
            {/* Value Label */}
            <text
              x={x + barWidth / 2}
              y={y + 20}
              textAnchor="middle"
              fontSize="13"
              fontWeight="bold"
              fill="#ffffff"
            >
              {item.value}
            </text>
            {/* Month Label */}
            <text
              x={x + barWidth / 2}
              y={chartHeight - padding + 20}
              textAnchor="middle"
              fontSize="13"
              fill="#2c3e50"
            >
              {item.month}
            </text>
          </g>
        );
      })}
    </svg>
  );
};

export default BarChart;
Understanding the Code
Let’s break down what’s happening in this Rss Letter No 0876 example:
- Data Structure: We define an array of objects, where each object represents a data point with a
month,value, andcolor.
- SVG viewBox: The
viewBoxattribute makes the chart fully responsive. It scales automatically to fit any container without losing quality.
- Dynamic Bar Rendering: We use
.map()to loop through the data array and create an SVG<rect>element for each bar. The bar’s height is calculated proportionally based on the maximum value.
- Labels: Each bar has two labels the value displayed on top and the month name below the x-axis.
Adding Interactivity with Hover Effects
Let’s make the Rss Letter No 0876 chart more interactive by adding hover effects:
jsx
import React, { useState } from 'react';

const InteractiveBarChart = () => {
  const [hoveredBar, setHoveredBar] = useState(null);

  const data = [
    { month: 'Jan', value: 60, color: '#3498db' },
    { month: 'Feb', value: 80, color: '#2ecc71' },
    { month: 'Mar', value: 70, color: '#e74c3c' },
    { month: 'Apr', value: 90, color: '#f39c12' },
    { month: 'May', value: 100, color: '#9b59b6' },
    { month: 'Jun', value: 50, color: '#1abc9c' },
  ];

  return (
    <svg viewBox="0 0 600 400" xmlns="http://www.w3.org/2000/svg">
      {data.map((item, index) => {
        const x = 100 + index * 80;
        const barHeight = (item.value / 100) * 275;
        const y = 340 - barHeight;
        const isHovered = hoveredBar === index;

        return (
          <g key={item.month}>
            <rect
              x={x}
              y={y}
              width="50"
              height={barHeight}
              fill={item.color}
              opacity={isHovered ? 0.8 : 1}
              onMouseEnter={() => setHoveredBar(index)}
              onMouseLeave={() => setHoveredBar(null)}
              style={{ cursor: 'pointer', transition: 'opacity 0.3s' }}
            />
            {isHovered && (
              <text
                x={x + 25}
                y={y - 10}
                textAnchor="middle"
                fontSize="14"
                fontWeight="bold"
                fill="#2c3e50"
              >
                {item.value}
              </text>
            )}
          </g>
        );
      })}
    </svg>
  );
};

export default InteractiveBarChart;
Building a Line Chart Variation
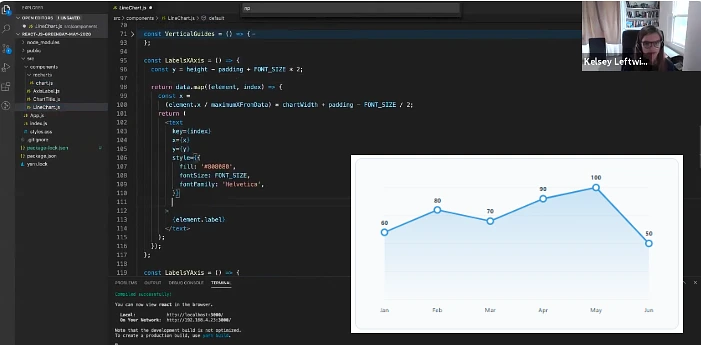
SVG isn’t limited to bar charts. Here’s a line chart version for this Rss Letter No 0876 tutorial:
jsx
import React from 'react';
const LineChart = () => {
const data = [60, 80, 70, 90, 100, 50];
const width = 600;
const height = 300;
const padding = 40;
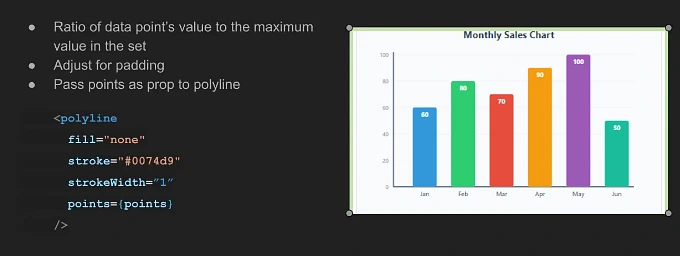
const points = data.map((value, index) => {
const x = padding + (index * (width - padding * 2)) / (data.length - 1);
const y = height - padding - (value / 100) * (height - padding * 2);
return `${x},${y}`;
}).join(' ');
return (
<svg viewBox={`0 0 ${width} ${height}`} xmlns="http://www.w3.org/2000/svg">
<polyline
points={points}
fill="none"
stroke="#3498db"
strokeWidth="3"
strokeLinecap="round"
strokeLinejoin="round"
/>
{data.map((value, index) => {
const x = padding + (index * (width - padding * 2)) / (data.length - 1);
const y = height - padding - (value / 100) * (height - padding * 2);
return (
<circle
key={index}
cx={x}
cy={y}
r="5"
fill="#2c3e50"
/>
);
})}
</svg>
);
};
export default LineChart;Using Your Chart Component
Import and use the chart in your main App component:
jsx
import React from 'react';
import BarChart from './BarChart';
import LineChart from './LineChart';

function App() {
  return (
    <div className="App" style={{ padding: '20px' }}>
      <h1>Rss Letter No 0876: SVG Charts Demo</h1>
      <BarChart />
      <LineChart />
    </div>
  );
}

export default App;
Best Practices for SVG Charts in React
When building SVG charts following this Rss Letter No 0876 guide, keep these tips in mind:
- Use
viewBoxfor responsiveness – never hardcode width and height in pixels. - Separate data from rendering – pass data as props for reusable components.
- Add accessibility attributes – use
aria-labelandrole="img"for screen readers. - Optimize re-renders – use
React.js for chart components with large datasets. - Use CSS transitions – for smooth animations on hover and data updates.